Initiating Coverage | Rubber-Retreading
January 31, 2015
Indag Rubber
ACCUMULATE
CMP
`897
Revival in CV volumes to fuel IRL’s growth
Target Price
`992
Investment Period
12 Months
Investment Arguments
Indag Rubber (IRL) to benefit from recovery in commercial vehicle industry: IRL
Stock Info
manufactures pre-cured tread rubber and ~90% of its revenue comes from the
Sector
Rubber-Retreading
commercial vehicle (CV) industry. The company would be a beneficiary of
Market Cap (` cr)
471
improving CV OEM sales hereon, as the retreading revenues accrue with a lag of
Net Debt (` cr)
(43)
5-6 month of new vehicle sales; retreading of new tyres is undertaken after
Beta
0.9
50,000km of the vehicle’s running, which typically happens in six months.
52 Week High / Low
1,100 / 212
During FY2013 and FY2014, the CV industry reported disappointing volumes
Avg. Daily Volume
2,614
owing to slow down in GDP growth and commercial activities which is also
Face Value (`)
10
reflected in company’s performance (top-line de-growth of ~1% in FY2014). In
BSE Sensex
29,183
9MFY2015, medium and heavy commercial vehicles (MHCVs) volumes have
Nifty
8,809
witnessed a recovery; also, there has been a recovery in light commercial vehicle
Reuters Code
IDGR.BO
(LCV) volumes with they showing relatively lower de-growth in 9MFY2015
compared to FY2014. This has been partly reflected in IRL’s 3QFY2015 revenues
Bloomberg Code
IDR@IN
and further benefits would be visible hereon given the improving economic cycle. We
expect growth momentum to continue in the CV segment (about 8% volume CAGR
Shareholding Pattern (%)
over FY2014-2017E) which would also be reflected in IRL’s revenues (we expect
Promoters
74.8
~10% CAGR top-line growth over the same period).
MF / Banks / Indian Fls
0.0
Lower penetration level to drive growth: Penetration level of retreading is lower in
FII / NRIs / OCBs
1.0
India as compared to other developed regions like USA, Europe etc. In India, the
Indian Public / Others
24.3
penetration level of retreading is at ~40% compared to 100% in USA and ~80%
in Europe as stated by the company. We believe that going forward, penetration
of retreading would increase on back of growth in road freight with improvement
Abs. (%)
3m 1yr
3yr
in economic activity, improving road infrastructure, and growing radialisation;
Sensex
6.7
42.4
73.1
demand for retreading will rise as new radial tryes are expensive and retreading
IRL
25.0
281.6
471.2
would prove to be a cheaper alternative towards increasing the life of the tyres.
Outlook and Valuation: We expect IRL to report a net sales CAGR of ~10% over
FY2014-17E to ~`311cr and net profit CAGR of ~11% over the same period to
`37cr. At the current market price of `897, the stock trades at a PE of 14.9x and
12.7x its FY2016E and FY2017E EPS of `60.1 and `70.8, respectively. We initiate
coverage on the stock with an Accumulate recommendation and target price of `992,
based on 14x FY2017E EPS, indicating an upside of ~11% from the current levels.
Key financials
Y/E March (` cr)
FY2014
FY2015E
FY2016E
FY2017E
Net sales
232
235
268
311
% chg
(1.2)
1.3
14.0
16.0
Net profit
28
30
32
37
% chg
10.3
7.7
6.3
17.8
EBITDA margin (%)
16.0
16.6
16.6
16.6
EPS (`)
52.5
56.5
60.1
70.8
P/E (x)
17.1
15.9
14.9
12.7
P/BV (x)
4.6
3.7
3.1
2.6
RoE (%)
26.7
23.4
20.8
20.6
RoCE (%)
33.7
28.7
27.2
26.7
Amarjeet S Maurya
EV/Sales (x)
1.8
1.7
1.5
1.2
022-39357800 Ext: 6831
EV/EBITDA (x)
11.5
10.5
9.0
7.5
Source: Company, Angel Research, Note: CMP as of January 30, 2015
Please refer to important disclosures at the end of this report
1
Indag Rubbers | Initiating Coverage
Investment Arguments
Indag Rubber (IRL) to benefit from recovery in commercial
vehicle industry
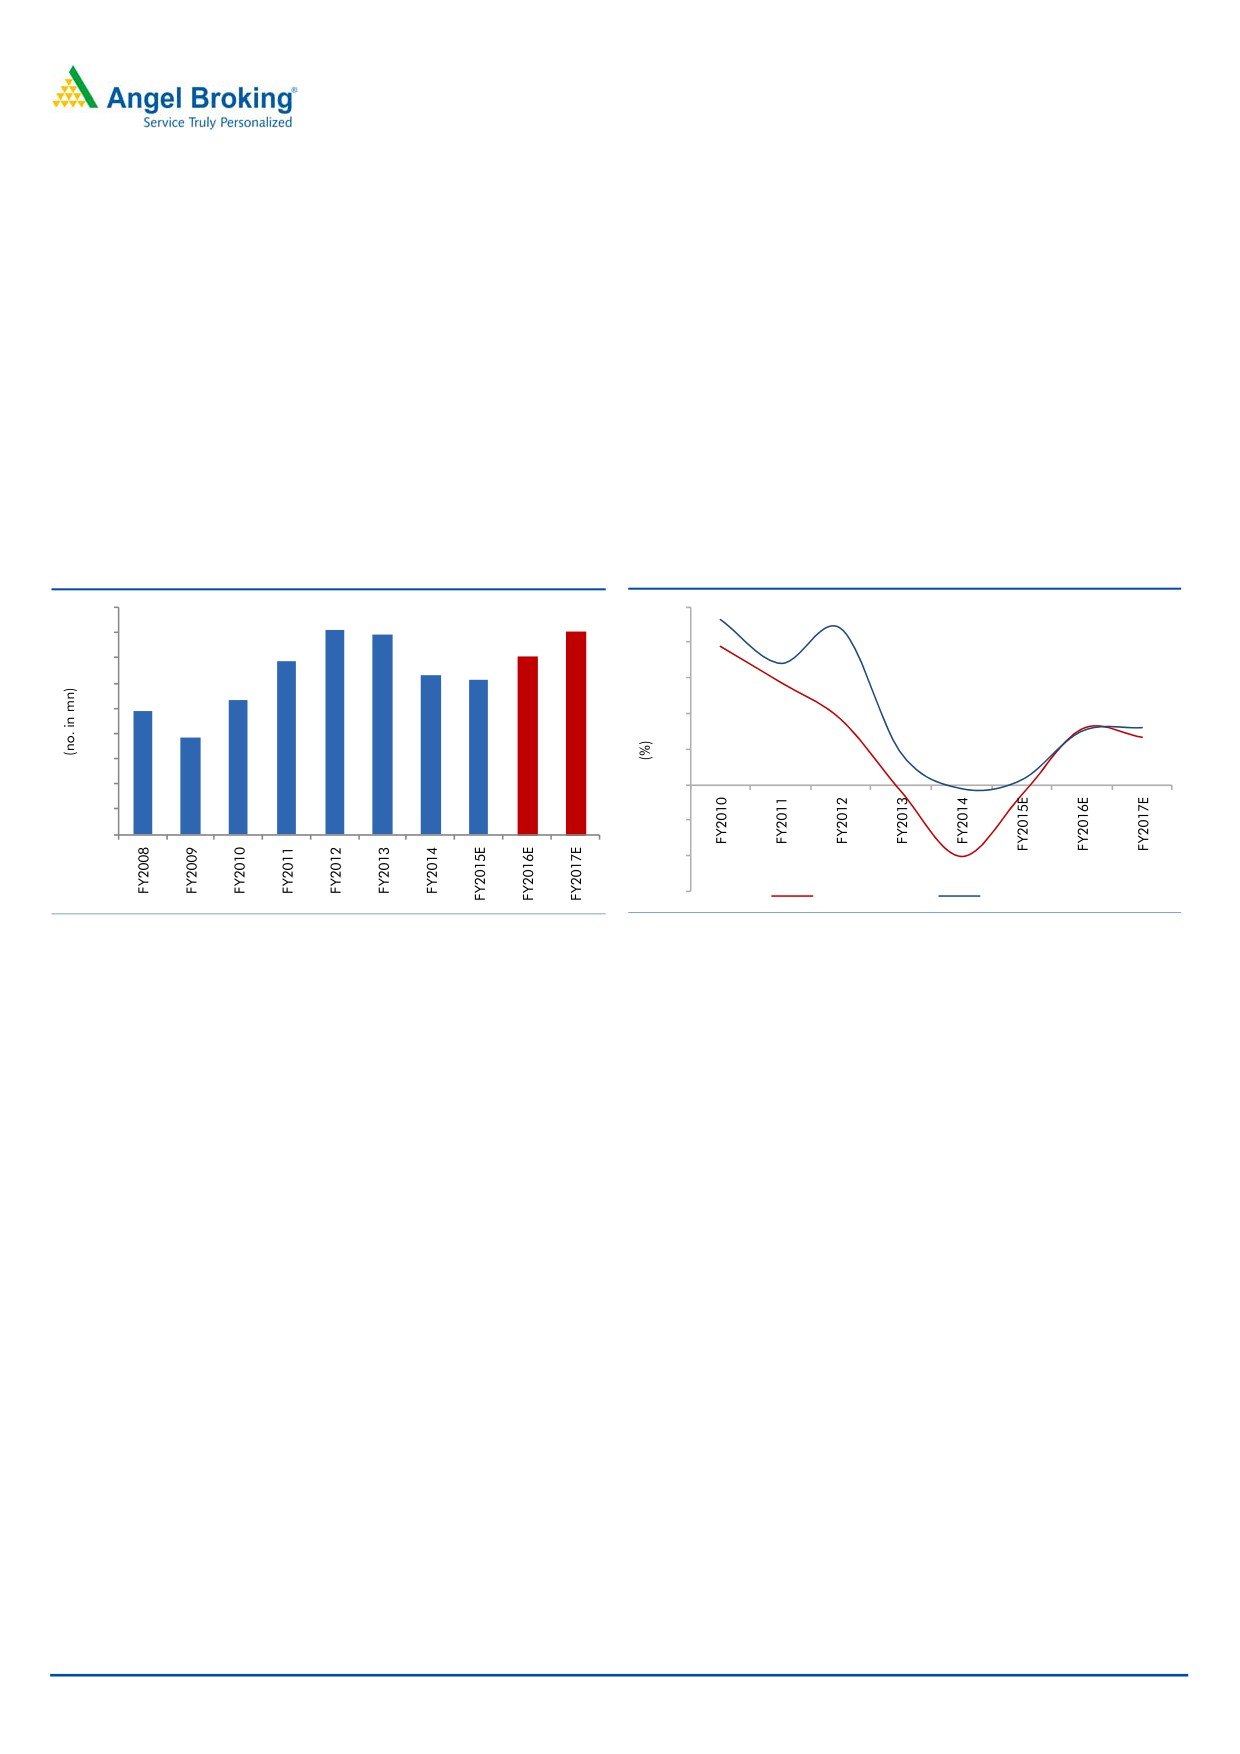
The CV industry in India compromises of two segments (a) MHCV and (b) LCV.
During FY2013 and FY2014, the CV industry reported disappointing volumes due
to slowdown in GDP growth and commercial activities. In 9MFY2015, the MHCV
segment showed recovery in volume growth, ie of ~10% yoy as against a ~25%
yoy de-growth for FY2014, owing to an improving economy. However, LCVs
volumes have failed to grow although they have posted a lower de-growth of
~13% yoy for 9MFY2015 as against a ~18% yoy de-growth for FY2014.
Exhibit 1: CV Industry (domestic) trend
Exhibit 2: CV Industry & IRL sales growth projection
0.9
50
0.8
40
0.7
30
0.6
0.5
20
0.4
10
0.3
0.2
0
0.1
(10)
-
(20)
(30)
CV Growth (%)
Indag Sales Growth (%)
Source: SIAM, Angel Research,
Source: SIAM, Angel Research
Considering momentum in policy reforms, fall in inflation, and anticipation of
further rate cuts by the Reserve Bank of India (RBI), we believe that the investment
cycle and commercial activities in the country will get a boost. This would lead to
improvement in GDP growth in FY2016 and FY2017, which in turn will assist
We expect the CV industry to report a
growth in the CV segment, ie mainly the LCV segment, which is currently
healthy ~8% CAGR over FY2014-17E
underperforming. Also, considering the overall improvement in demand for
MHCVs as well as lower de-growth in LCV volumes during 9MFY2015, we expect
the CV industry to report a healthy ~8% CAGR over FY2014-17E.
IRL caters to various segments including CVs, tractors, and the off-the-road (OTR)
in retreading manufacturing. MHCVs (mainly trucks and buses) account for the
largest chunk of its sales (85%) followed by LCVs at 5%, and the balance is
MHCVs (mainly trucks and buses)
accounted by others segments. Thus, we believe that IRL is best placed to take
account for the largest chunk of the
advantage of an expected recovery in the CV industry. Moreover, over the last six
company’s sales
(85%) followed by
years, we have witnessed a strong correlation between volume growth in the CV
LCVs at
5%, and the balance is
industry and volume growth of IRL. The benefits at IRL’s end will be accrued with a
accounted by others segments
lag effect of 5-6 months as generally retreading of new tyres is undertaken after
50,000km. We expect this trend to continue going forward. Thus, in our view, IRL
would benefit from a recovery in the CV industry, going forward.
January 31, 2015
2
Indag Rubbers | Initiating Coverage
Growth to be driven by shift in trend from unorganized to
organized sector
The current tread manufacturing
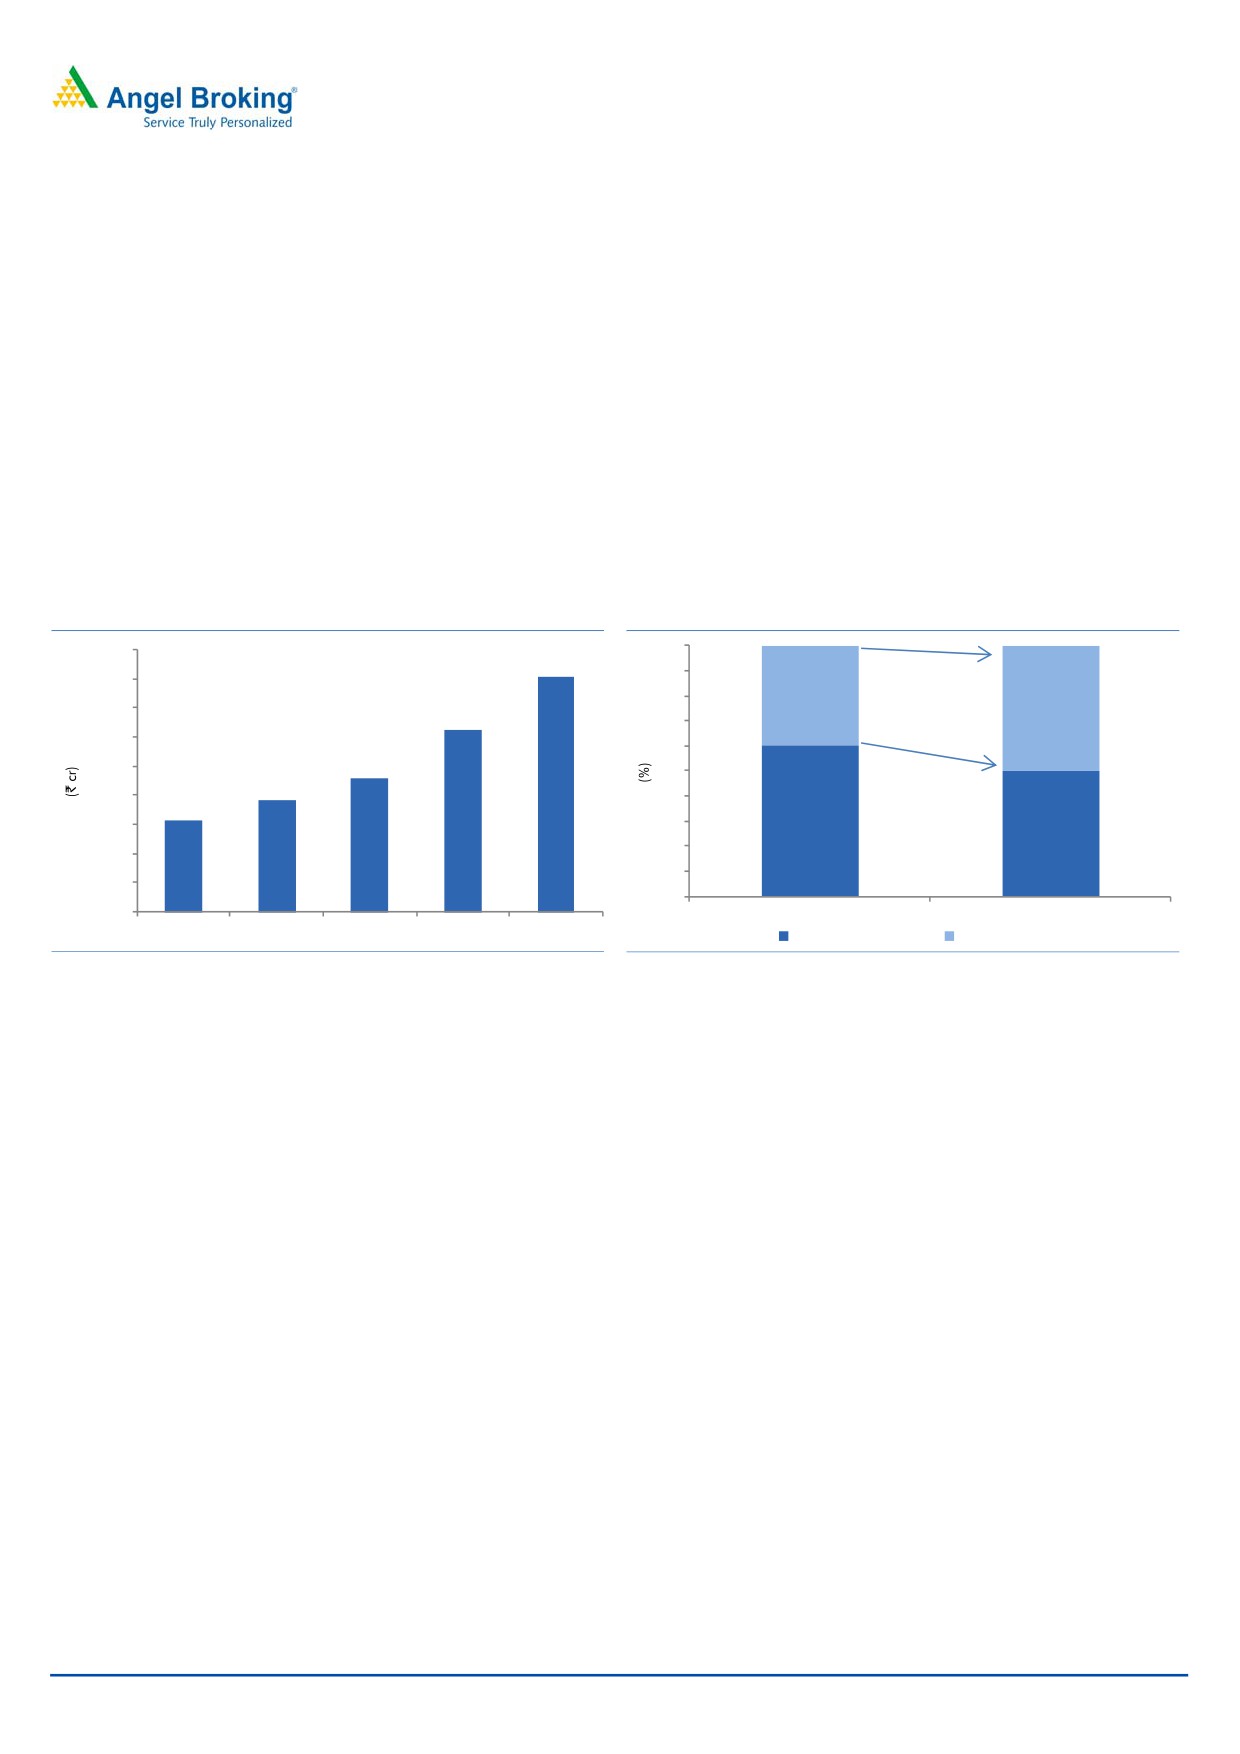
The current tread manufacturing industry’s size is of ~`3,200cr, almost equally
industry’s size is of ~`3,200cr, almost
shared by unorganized and organized players. The tread manufacturing industry
equally shared by unorganized and
grew at a CAGR of ~5% over FY2011-14. Going forward, we believe the industry
organized players
would outperform its historical growth, owing to improved economic activity and
increase in penetration levels considering that the current penetration levels are
lower than in developed countries. Further, we also believe that the organized
sector would gain market share from unorganized players due to shift in consumer
preference for quality of retreading products. Also, implementation of the GST,
going forward, could reduce the pricing gap between organized and unorganized
players, thereby rendering the organized players’ pricing equally attractive.
Exhibit 3: Tread Manufacturing Industry
Exhibit 4: Market share gain by organized players
3,300
100
90
3,200
80
40
3,100
50
70
3,000
60
2,900
50
2,800
40
2,700
30
60
50
20
2,600
10
2,500
0
2,400
FY2010
FY2014
FY2010
FY2011
FY2012
FY2013
FY2014
Unorganized Markets
Organized Markets
Source: Company, Angel Research
Source: Company, Angel Research
Hence, we believe that IRL is best placed to gain market share on back of better
Currently the company has
20-22%
product quality, being a strong brand in the segment, and with it having a wide
market share in the organized cold
distribution network. Currently the company has 20-22% market share in the
process market
organized cold process market.
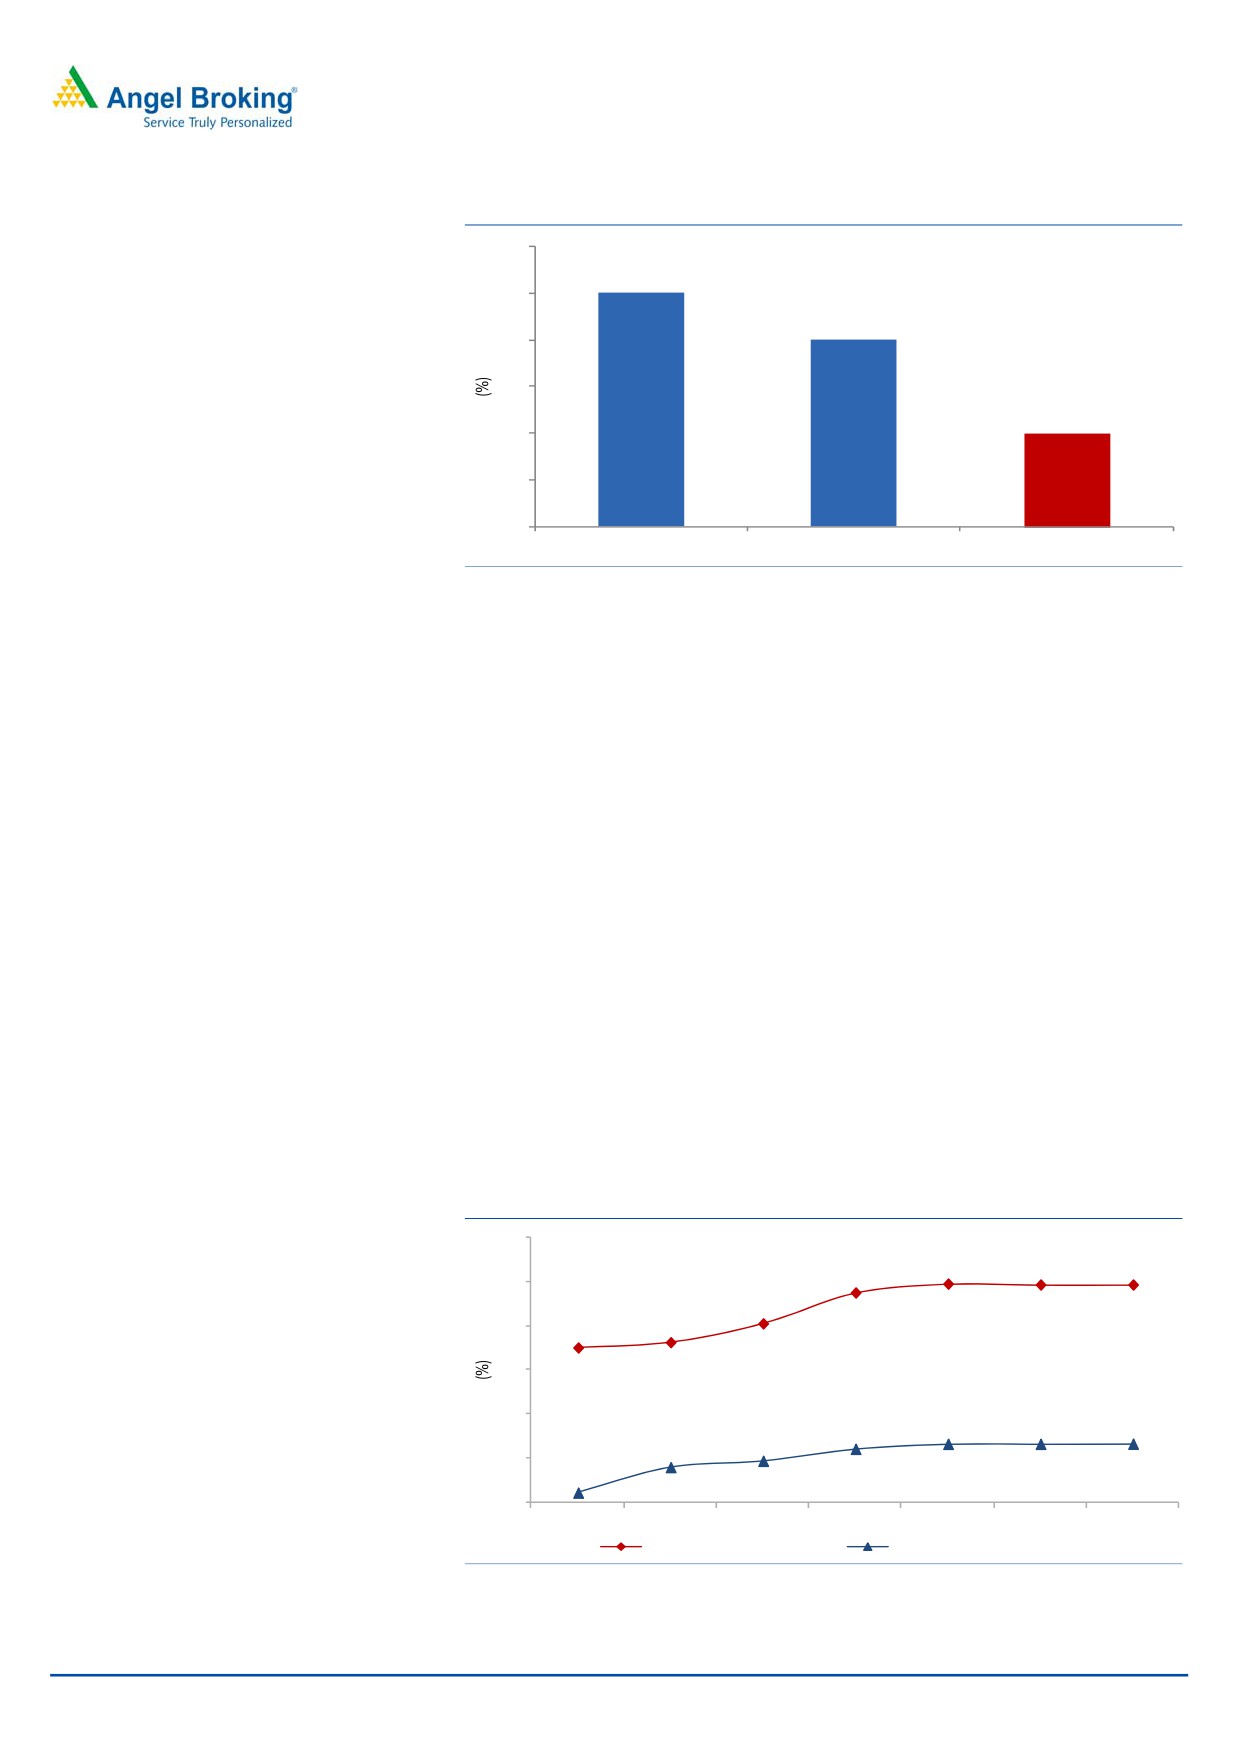
Lower penetration levels suggest huge potential for growth
Penetration level of retreading is lower in India as compared to other developed
regions like USA, Europe etc. In India, the penetration level of retreading is at
The penetration level in India is at
~40% compared to 100% in USA and ~80% in Europe as stated by the company.
~40% compared to almost 100% in
We believe that going forward, penetration of retreading would increase on back
USA and ~80% in Europe
of growth in road freight with improvement in economic activity, improving road
infrastructure, and growing radialisation; demand for retreading will rise as new
radial tryes are expensive and retreading would prove to be a cheaper alternative
towards increasing the life of the tyres.
January 31, 2015
3
Indag Rubbers | Initiating Coverage
Exhibit 5: Global data of penetration level in retreading
120
100
100
80
80
60
40
40
20
0
USA
Europe
India
Source: Company, Angel Research
Focus on expansion of distribution network
To push sales, the company is continuously focusing on increasing dealerships for
Currently, the company has more than
its products. Currently, the company has more than 100-150 dealers, 500-600
100-150 dealers, 500-600 retreaders,
retreaders, 25 depots pan India and the number is growing rapidly. In the last 2-3
25 depots pan India and the number is
years, the company is increasing its distribution network by an average of 10%.
growing rapidly
Going forward too, the company is expected to continue to grow its distribution
network at a similar rate.
Consistent operating margin improvement
IRL has consistently been reporting margin improvement over the last four years on
back of its effective cost management strategy including cost savings in raw
materials through research & development (R&D). The company has reported
operating margin improvement from 11.1% in FY2011 to 16.0% in FY2014. Also
IRL has reported a 60-70bp margin
the company has report a 60-70bp margin improvement in 9MFY2015. We
improvement in 9MFY2015
believe that going forward, the company would continue to deliver a healthy
performance on the operating margin front on the back of lower natural rubber
and crude prices and owing to its effective cost management strategy. However,
we have conservatively not factored in any improvement in the operating
performance in our model as the margin is at its peak level.
Exhibit 6: Gross profit margin & Operating margin trend
40
35
30
25
20
15
10
FY2011
FY2012
FY2013
FY2014
FY2015E FY2016E FY2017E
Gross Profit Margin (%)
Operating Margin (%)
Source: Company, Angel Research
January 31, 2015
4
Indag Rubbers | Initiating Coverage
Outlook and Valuation
Going ahead, we expect IRL to report a top-line CAGR of ~10% over FY2014-17E
Going ahead, we expect IRL to report a
to ~`311cr owing to recovery in CV volumes in the domestic market with ~85% of
top-line
CAGR of
~10% over
IRL’s revenue coming from the MHCV segment and ~5% of revenue coming from
FY2014-17E to ~`311cr
the LCV segment. Growth in CV volumes will lead to recurring business
opportunities for companies like IRL. Going ahead, the company would improve its
volume growth in the treading segment on back of growth in road freight with
growth in economic activity, increase in organized players’ market share, strong
distribution network, and a strong brand. The company is in the process of
expanding capacity by 4,000MT in FY2016.
On the bottom-line front, we expect the company to report an 11% CAGR over
FY2014-17E on account of healthy top-line growth and operating margin and with
We expect the company to report an
higher other income (Cash + Investment at ~`54cr on balance sheet which are
11% CAGR over FY2014-17E
likely to increase further). Moreover, the company is also asset light, has zero debt,
and is able to post a healthy return ratio, which make the balance sheet all the
more attractive.
At the current market price of `897, the stock trades at a PE of 14.9x and 12.7x its
FY2016E and FY2017E EPS of `60.1 and `70.8, respectively. We initiate coverage
on the stock with an Accumulate recommendation and target price of `992, based
on 14x FY2017E EPS, indicating an upside of ~11% from the current levels.
The downside risks to our estimates include 1) increase in competition
from unorganized players would impact overall growth of the company 2) any
increase in input costs (ie increase in natural rubber and crude oil prices, etc.)
could negatively impact profitability, and 3) lower-than-expected CV volume
growth could affect business growth.
January 31, 2015
5
Indag Rubbers | Initiating Coverage
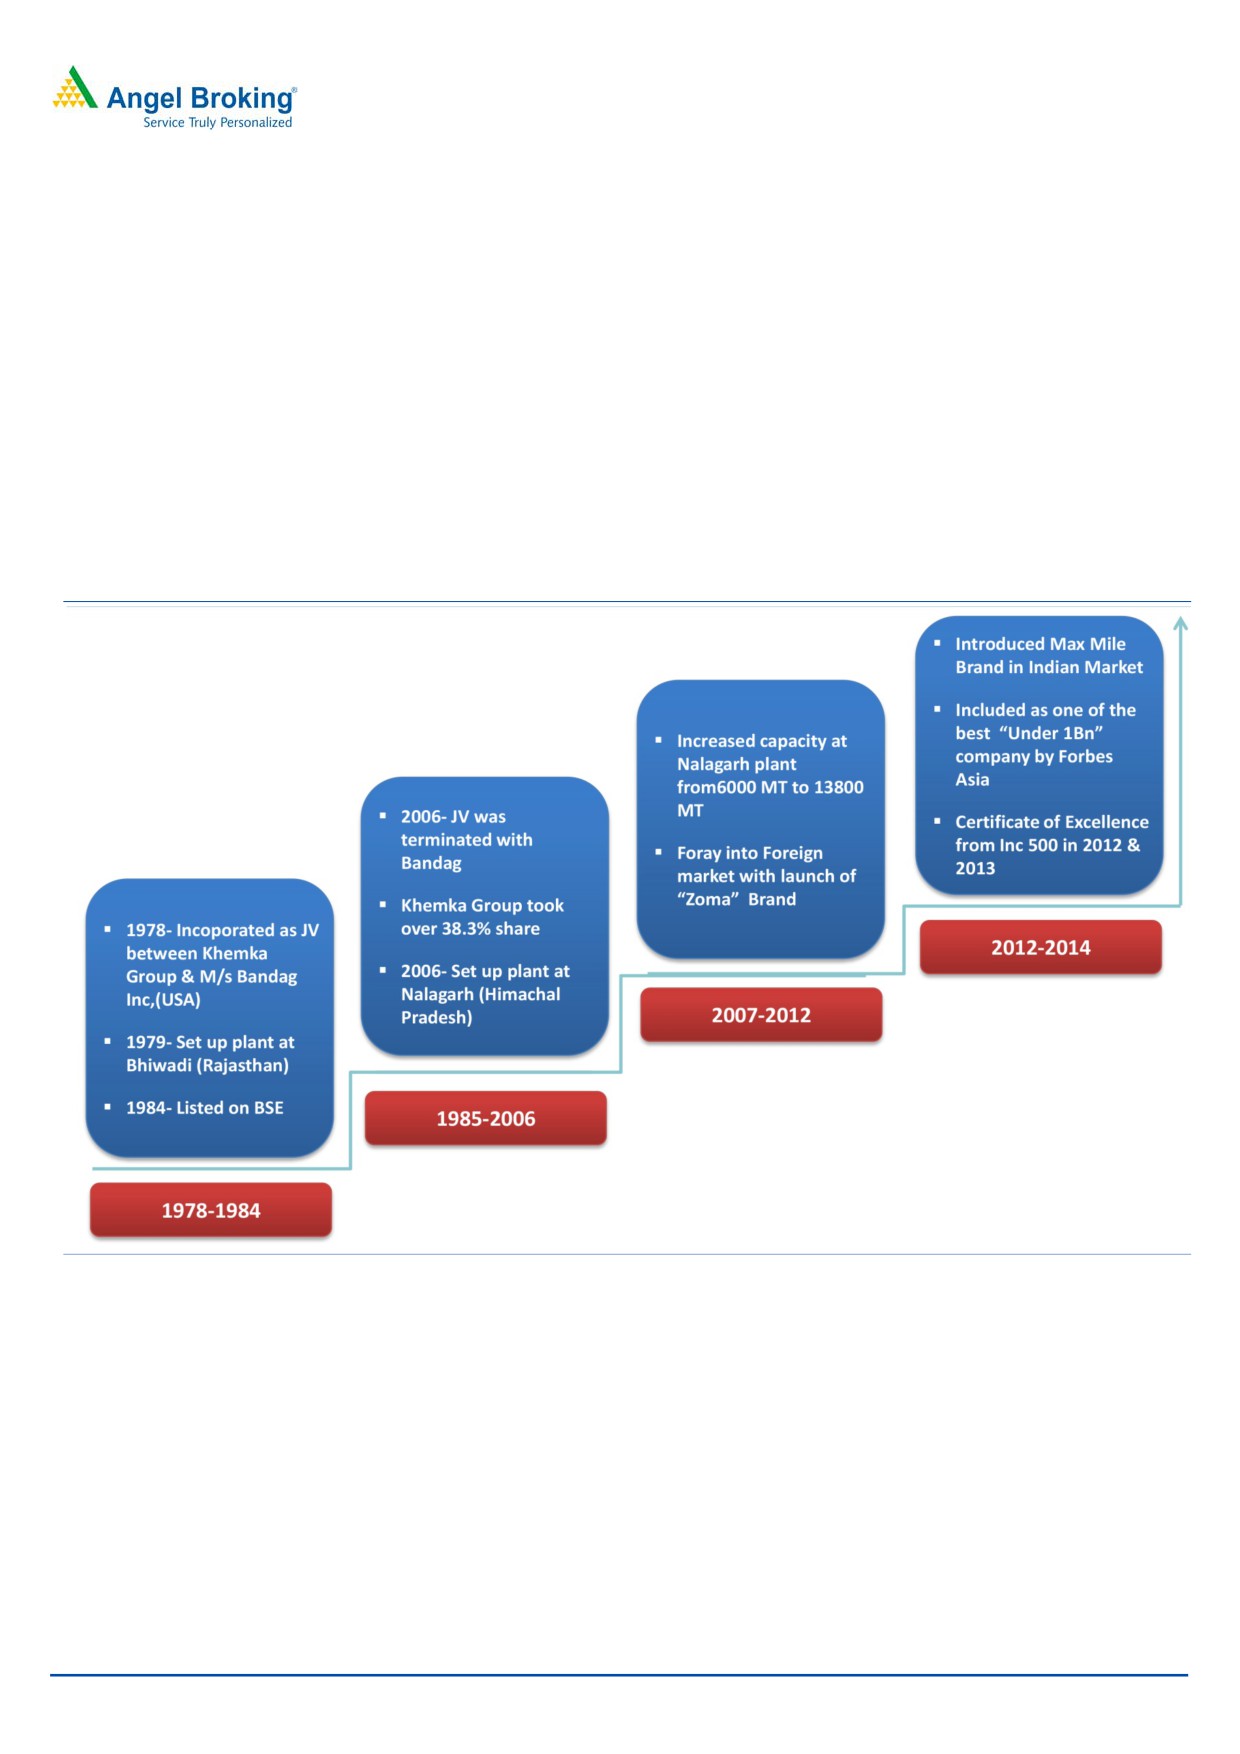
Company Background
Indag Rubber is an India-based company. The company manufactures pre-cured
tread rubber, unvulcanized rubber strip gum, universal spray cement, tire
envelopes, repair gum, and other accessories and equipment for the tire
retreading industry. Close to 90% of the company's revenue is generated from the
sale of pre-cured tread. Indag Rubber distributes its range of products under the
company’s three major brands, which include Indag, Zoma and Maxmile. The
company also has anexports business which contributes 2-3% to the total revenue.
The company’s manufacturing plant is at Nalagarh, Himachal Pradesh with a
capacity of 13,800MT for tread rubber, 1,800MT for rubber strip gums, and
1,800KL for rubber cement.
Exhibit 7: Company Profile
Source: Company, Angel Research
January 31, 2015
6
Indag Rubbers | Initiating Coverage
Profit & Loss Statement
Y/E March (` cr)
FY2012
FY2013
FY2014FY2015E
FY2016E
FY2017E
Total operating income
216
235
232
235
268
311
% chg
44.0
8.8
(1.2)
1.3
14.0
16.0
Total Expenditure
186
201
195
196
224
259
Cost of Materials
156
164
154
154
175
204
Personnel
11
13
15
17
20
25
Others
20
23
26
25
28
31
EBITDA
30
35
37
39
45
52
% chg
81.3
14.4
7.9
4.8
14.0
16.1
(% of Net Sales)
14.0
14.7
16.0
16.6
16.6
16.6
Depreciation & Amortisation
2
2
3
3
3
3
EBIT
28
32
35
36
41
48
% chg
89.1
15.0
8.4
4.6
13.7
16.7
(% of Net Sales)
12.9
13.6
15.0
15.5
15.4
15.5
Interest & other Charges
1
0
0
0
0
0
Other Income
0
1
1
3
4
5
(% of PBT)
0.2
3.1
4.0
8.1
8.5
9.4
Share in profit of Associates
-
-
-
-
-
-
Recurring PBT
27
33
36
39
45
53
% chg
98.0
21.8
9.5
9.6
14.2
17.8
Prior Period & Extraord. Exp./(Inc.)
-
-
-
-
-
-
PBT (reported)
27
33
36
39
45
53
Tax
6
8
8
10
14
16
(% of PBT)
22.7
24.1
23.5
24.8
30.0
30.0
PAT (reported)
21
25
28
30
32
37
ADJ. PAT
21
25
28
30
32
37
% chg
94.1
19.6
10.3
7.7
6.3
17.8
(% of Net Sales)
9.6
10.6
11.9
12.6
11.8
11.9
Basic EPS (`)
39.8
47.6
52.5
56.5
60.1
70.8
Fully Diluted EPS (`)
39.8
47.6
52.5
56.5
60.1
70.8
% chg
94.1
19.6
10.3
7.7
6.3
17.8
January 31, 2015
7
Indag Rubbers | Initiating Coverage
Balance Sheet
Y/E March (` cr)
FY2012
FY2013
FY2014 FY2015E FY2016E FY2017E
SOURCES OF FUNDS
Equity Share Capital
5
5
5
5
5
5
Reserves& Surplus
56
76
98
122
146
175
Shareholders Funds
62
82
103
127
152
181
Total Loans
1
-
-
-
-
-
Deferred Tax Liability
1
2
2
2
2
2
Total Liabilities
64
83
105
129
154
183
APPLICATION OF FUNDS
Gross Block
44
44
45
48
56
61
Less: Acc. Depreciation
20
21
22
25
28
32
Net Block
24
23
23
23
28
30
Capital Work-in-Progress
0
0
4
4
4
4
Investments
1
27
40
51
60
70
Current Assets
62
60
66
79
92
114
Inventories
34
32
32
34
40
49
Sundry Debtors
21
21
26
27
32
39
Cash
2
2
3
10
11
15
Loans & Advances
2
2
3
3
3
4
Other Assets
4
4
3
4
5
7
Current liabilities
24
28
29
29
31
35
Net Current Assets
39
33
37
50
61
78
Deferred Tax Asset
0
0
1
1
1
1
Mis. Exp. not written off
-
-
-
-
-
-
Total Assets
64
83
105
129
154
183
January 31, 2015
8
Indag Rubbers | Initiating Coverage
Cashflow Statement
Y/E March (` cr)
FY2012
FY2013
FY2014 FY2015E FY2016E FY2017E
Profit before tax
27
33
36
39
45
53
Depreciation
2
2
3
3
3
3
Change in Working Capital
(9)
5
(5)
(5)
(11)
(13)
Interest / Dividend (Net)
1
(1)
(1)
0
0
0
Direct taxes paid
(5)
(7)
(8)
(10)
(14)
(16)
Others
(1)
(0)
(0)
0
0
0
Cash Flow from Operations
16
32
25
27
24
27
(Inc.)/ Dec. in Fixed Assets
(6)
(1)
(4)
(3)
(8)
(5)
(Inc.)/ Dec. in Investments
(1)
(26)
(13)
(11)
(9)
(10)
Cash Flow from Investing
(6)
(27)
(17)
(14)
(17)
(15)
Issue of Equity
0
0
0
0
0
0
Inc./(Dec.) in loans
(6)
(1)
0
0
0
0
Dividend Paid (Incl. Tax)
(2)
(4)
(5)
(6)
(7)
(8)
Interest / Dividend (Net)
(1)
(0)
(1)
(0)
(0)
(0)
Cash Flow from Financing
(9)
(5)
(6)
(6)
(7)
(8)
Inc./(Dec.) in Cash
0
0
1
7
0
4
Opening Cash balances
1
2
2
3
10
11
Closing Cash balances
2
2
3
10
11
15
January 31, 2015
9
Indag Rubbers | Initiating Coverage
Key Ratios
Y/E March
FY2012
FY2013
FY2014 FY2015E FY2016E FY2017E
Valuation Ratio (x)
P/E (on FDEPS)
22.6
18.9
17.1
15.9
14.9
12.7
P/CEPS
20.3
17.1
15.7
14.5
13.5
11.6
P/BV
7.6
5.8
4.6
3.7
3.1
2.6
Dividend yield (%)
0.7
0.9
1.1
1.3
1.4
1.7
EV/Sales
2.2
1.9
1.8
1.7
1.5
1.2
EV/EBITDA
15.6
12.8
11.5
10.5
9.0
7.5
EV / Total Assets
5.4
4.0
3.2
2.6
2.2
1.8
Per Share Data (`)
EPS (Basic)
39.8
47.6
52.5
56.5
60.1
70.8
EPS (fully diluted)
39.8
47.6
52.5
56.5
60.1
70.8
Cash EPS
44.2
52.3
57.3
61.7
66.2
77.5
DPS
6.0
8.0
10.0
11.3
12.6
15.6
Book Value
117.3
155.5
196.3
241.5
289.0
344.3
Returns (%)
ROCE
44.3
39.3
33.7
28.7
27.2
26.7
Angel ROIC (Pre-tax)
45.8
60.3
58.2
55.5
51.1
50.4
ROE
33.9
30.6
26.7
23.4
20.8
20.6
Turnover ratios (x)
Asset Turnover (Gross Block)
8.9
10.1
10.1
10.1
9.6
10.5
Inventory / Sales (days)
57
49
50
53
55
57
Receivables (days)
36
33
40
42
44
46
Payables (days)
26
22
21
20
19
18
WC cycle (ex-cash) (days)
67
60
69
75
80
85
January 31, 2015
10
Indag Rubbers | Initiating Coverage
Research Team Tel: 022 - 39357800
DISCLAIMER
This document is solely for the personal information of the recipient, and must not be singularly used as the basis of any investment
decision. Nothing in this document should be construed as investment or financial advice. Each recipient of this document should
make such investigations as they deem necessary to arrive at an independent evaluation of an investment in the securities of the
companies referred to in this document (including the merits and risks involved), and should consult their own advisors to determine
the merits and risks of such an investment.
Angel Broking Pvt. Limited, its affiliates, directors, its proprietary trading and investment businesses may, from time to time, make
investment decisions that are inconsistent with or contradictory to the recommendations expressed herein. The views contained in this
document are those of the analyst, and the company may or may not subscribe to all the views expressed within.
Reports based on technical and derivative analysis center on studying charts of a stock's price movement, outstanding positions and
trading volume, as opposed to focusing on a company's fundamentals and, as such, may not match with a report on a company's
fundamentals.
The information in this document has been printed on the basis of publicly available information, internal data and other reliable
sources believed to be true, but we do not represent that it is accurate or complete and it should not be relied on as such, as this
document is for general guidance only. Angel Broking Pvt. Limited or any of its affiliates/ group companies shall not be in any way
responsible for any loss or damage that may arise to any person from any inadvertent error in the information contained in this report.
Angel Broking Pvt. Limited has not independently verified all the information contained within this document. Accordingly, we cannot
testify, nor make any representation or warranty, express or implied, to the accuracy, contents or data contained within this document.
While Angel Broking Pvt. Limited endeavours to update on a reasonable basis the information discussed in this material, there may be
regulatory, compliance, or other reasons that prevent us from doing so.
This document is being supplied to you solely for your information, and its contents, information or data may not be reproduced,
redistributed or passed on, directly or indirectly.
Angel Broking Pvt. Limited and its affiliates may seek to provide or have engaged in providing corporate finance, investment banking
or other advisory services in a merger or specific transaction to the companies referred to in this report, as on the date of this report or
in the past.
Neither Angel Broking Pvt. Limited, nor its directors, employees or affiliates shall be liable for any loss or damage that may arise from
or in connection with the use of this information.
Note: Please refer to the important `Stock Holding Disclosure' report on the Angel website (Research Section). Also, please refer to the
latest update on respective stocks for the disclosure status in respect of those stocks. Angel Broking Pvt. Limited and its affiliates may
have investment positions in the stocks recommended in this report.
Disclosure of Interest Statement
Indag Rubber
1. Analyst ownership of the stock
No
2. Angel and its Group companies ownership of the stock
No
3. Angel and its Group companies' Directors ownership of the stock
No
4. Broking relationship with company covered
No
Note: We have not considered any Exposure below ` 1 lakh for Angel, its Group companies and Directors
Ratings (Returns):
Buy (> 15%)
Accumulate (5% to 15%)
Neutral (-5 to 5%)
Reduce (-5% to -15%)
Sell (< -15%)
January 31, 2015
11
Indag Rubbers | Initiating Coverage
6th Floor, Ackruti Star, Central Road, MIDC, Andheri (E), Mumbai- 400 093. Tel: (022) 39357800
Research Team
Fundamental:
Sarabjit Kour Nangra
VP-Research, Pharmaceutical
Vaibhav Agrawal
VP-Research (Banking)
Amarjeet Maurya
Analyst (FMCG, Media, Mid-Cap)
Bharat Gianani
Analyst (Automobile)
Rahul Dholam
Analyst (Metal, Oil & Gas)
Santosh Yellapu
Analyst (Infrastructure)
Shrenik Gujrathi
Analyst (Cap Goods, Cement)
Umesh Matkar
Analyst (Banking)
Twinkle Gosar
Analyst (Mid-Cap)
Tejas Vahalia
Research Editor
Technicals and Derivatives:
Siddarth Bhamre
Head - Technical & Derivatives
Sameet Chavan
Technical Analyst
Sneha Seth
Associate (Derivatives)
Institutional Sales Team:
Mayuresh Joshi
VP - Institutional Sales
Meenakshi Chavan
Dealer
Gaurang Tisani
Assistant Manager
Production Team:
Dilip Patel
Production Incharge
CSO & Registered Office: G-1, Ackruti Trade Centre, Road No. 7, MIDC, Andheri (E), Mumbai - 93. Tel: (022) 3083 7700. Angel Broking Pvt. Ltd: BSE Cash: INB010996539 / BSE F&O: INF010996539, CDSL Regn. No.: IN - DP - CDSL - 234 - 2004, PMS Regn. Code: PM/INP000001546, NSE Cash: INB231279838 /
NSE F&O: INF231279838 / NSE Currency: INE231279838, MCX Stock Exchange Ltd: INE261279838 / Member ID: 10500. Angel Commodities Broking (P) Ltd.: MCX Member ID: 12685 / FMC Regn. No.: MCX / TCM / CORP / 0037 NCDEX: Member ID 00220 / FMC Regn. No.: NCDEX / TCM / CORP / 0302.
January 31, 2015
12